Part 6: You Can't See Your Agents — Visibility Is Written Down, Not Assumed
60-second video version of this part.
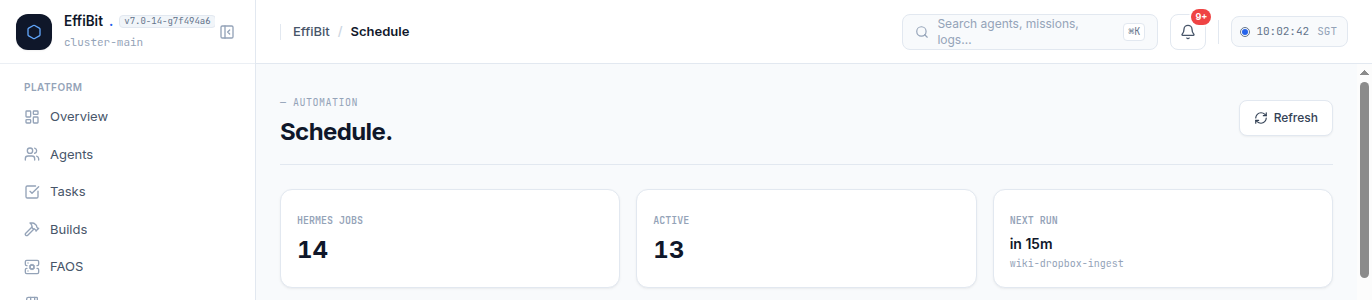
On paper the fleet looks great: an orchestrator, four specialists, shared memory. One problem is left, and it quietly kills more agent projects than any other: you can't see what is happening. Five sessions in parallel is five windows you aren't watching. And an agent that does real work but never writes anything down is invisible. Part 7 is the bug that proved it to us.
The core rule
Agents don't reveal what they're doing unless they write it down. A dashboard can't read an agent's mind. It can only read durable state. So visibility is built on the Part 5 foundation: the shared files and the shared log. If an agent logs its work, you can see it. If it doesn't, it's invisible no matter how busy it is.
Two sources of truth
1. The shared task log. Every agent runs the task-log script, which writes a row to a shared SQLite database: who did what, and whether it succeeded.
bash ~/.hermes/agents/_shared/log-task-local.sh "<agent>" "<description>" "<completed|failed>" "<model>"
2. The engine's own log. To know which model really served a turn, don't ask the agent. A self-report can be wrong. Hermes writes a line at dispatch time, independent of anything the agent says:
grep "conversation turn: session=" ~/.hermes/logs/agent.log | tail -5
Each line carries the session, the model and the provider that actually served the turn. For a specialist, look in that profile's own log: ~/.hermes/profiles/<name>/logs/agent.log.
What hermes dashboard is, and isn't
Hermes ships a hermes dashboard command: a web panel about Hermes itself. A fleet status view, with per-agent task counts and load, is a different thing. You build it on top of the task log. Hermes' dashboard is a panel about Hermes. A fleet status view is a panel about your agents, built from their logs.
"No data" is not "idle"
The most dangerous misreading: a row showing 0 tasks and 0% load, and you assume the agent is resting. It could be idle. Or it could be working flat out and not logging. The numbers mean exactly what the log says, nothing more. If the work isn't logged, the status is a lie about reality.
Build the view from what exists
Because agents already write durable state, a status view is assembly, not new data capture:
- Read the task-log database for each agent's task count and success or failure.
- Read the shared lessons file for what the fleet learned recently.
- Read the per-agent output folders for what each specialist delivered.
- Check the engine log for which model served each turn.
The prompt-based path
I have a Hermes agent fleet that all logs to a shared SQLite DB via a
log-task-local.sh script, plus a shared lessons markdown file, per-agent
output folders, and an agent.log that records which model served each
turn. Build me a simple status view that reads ONLY from these existing
sources. Don't add new tracking. It should show, per agent: task count,
rough load, success or failure, most recent lesson, and most recent
deliverable. Make clear in the UI when an agent shows zero activity that it
might just not be logging, not actually idle.
Why this prompt works: "reads ONLY from these existing sources" is the load-bearing line. It stops the assistant inventing a parallel tracking system and forces reuse of the four sources above. The per-agent field list maps one-to-one onto the bullets. The last sentence bakes the "no data is not idle" trap into the spec, so the assistant can't ship the exact misreading this post warns about.
The takeaway
Visibility isn't a dashboard app. It's a discipline: agents write durable state, and a view assembles it. Expect the view to show things agents never logged and it lies.
Next: the day we got this wrong. Our orchestrator sat at 0% on its own dashboard.